


Imagining Forward: Visual Storytelling to Make Research More Accessible for Practice
When you are lost in information, you need a visual map

This post originally appeared on SAGE MethodSpace in March 2020, during the Mentor in Residence tenure of Dr. Sharon Ravitch, just as we were settling into the unknown of COVID. It has been reproduced here with permission.
Note from Dr. Sharon M. Ravitch
This piece, Imagining Forward: Visual Storytelling to Make Research Accessible for Practice, is a vital contribution to qualitative research methodology. This post speaks to the research imagination as it relates to representations of research meanings and data. The piece focuses on the ways that qualitative researchers can, and we argue, should, re-imagine our approaches to conducting research broadly, and specifically our methods for analyzing, sharing, and representing data.
Readers–I hope you’ll finish reading this piece with innovative ideas that will make your research process and products exponentially more generative and actionable! And stay tuned, we are writing a book on this soon…..
If this article resonates, please click the ♥️ above!
By Jane R. Shore
“The greatest value of a picture is when it forces us to notice what we never expected to see.” John Tukey
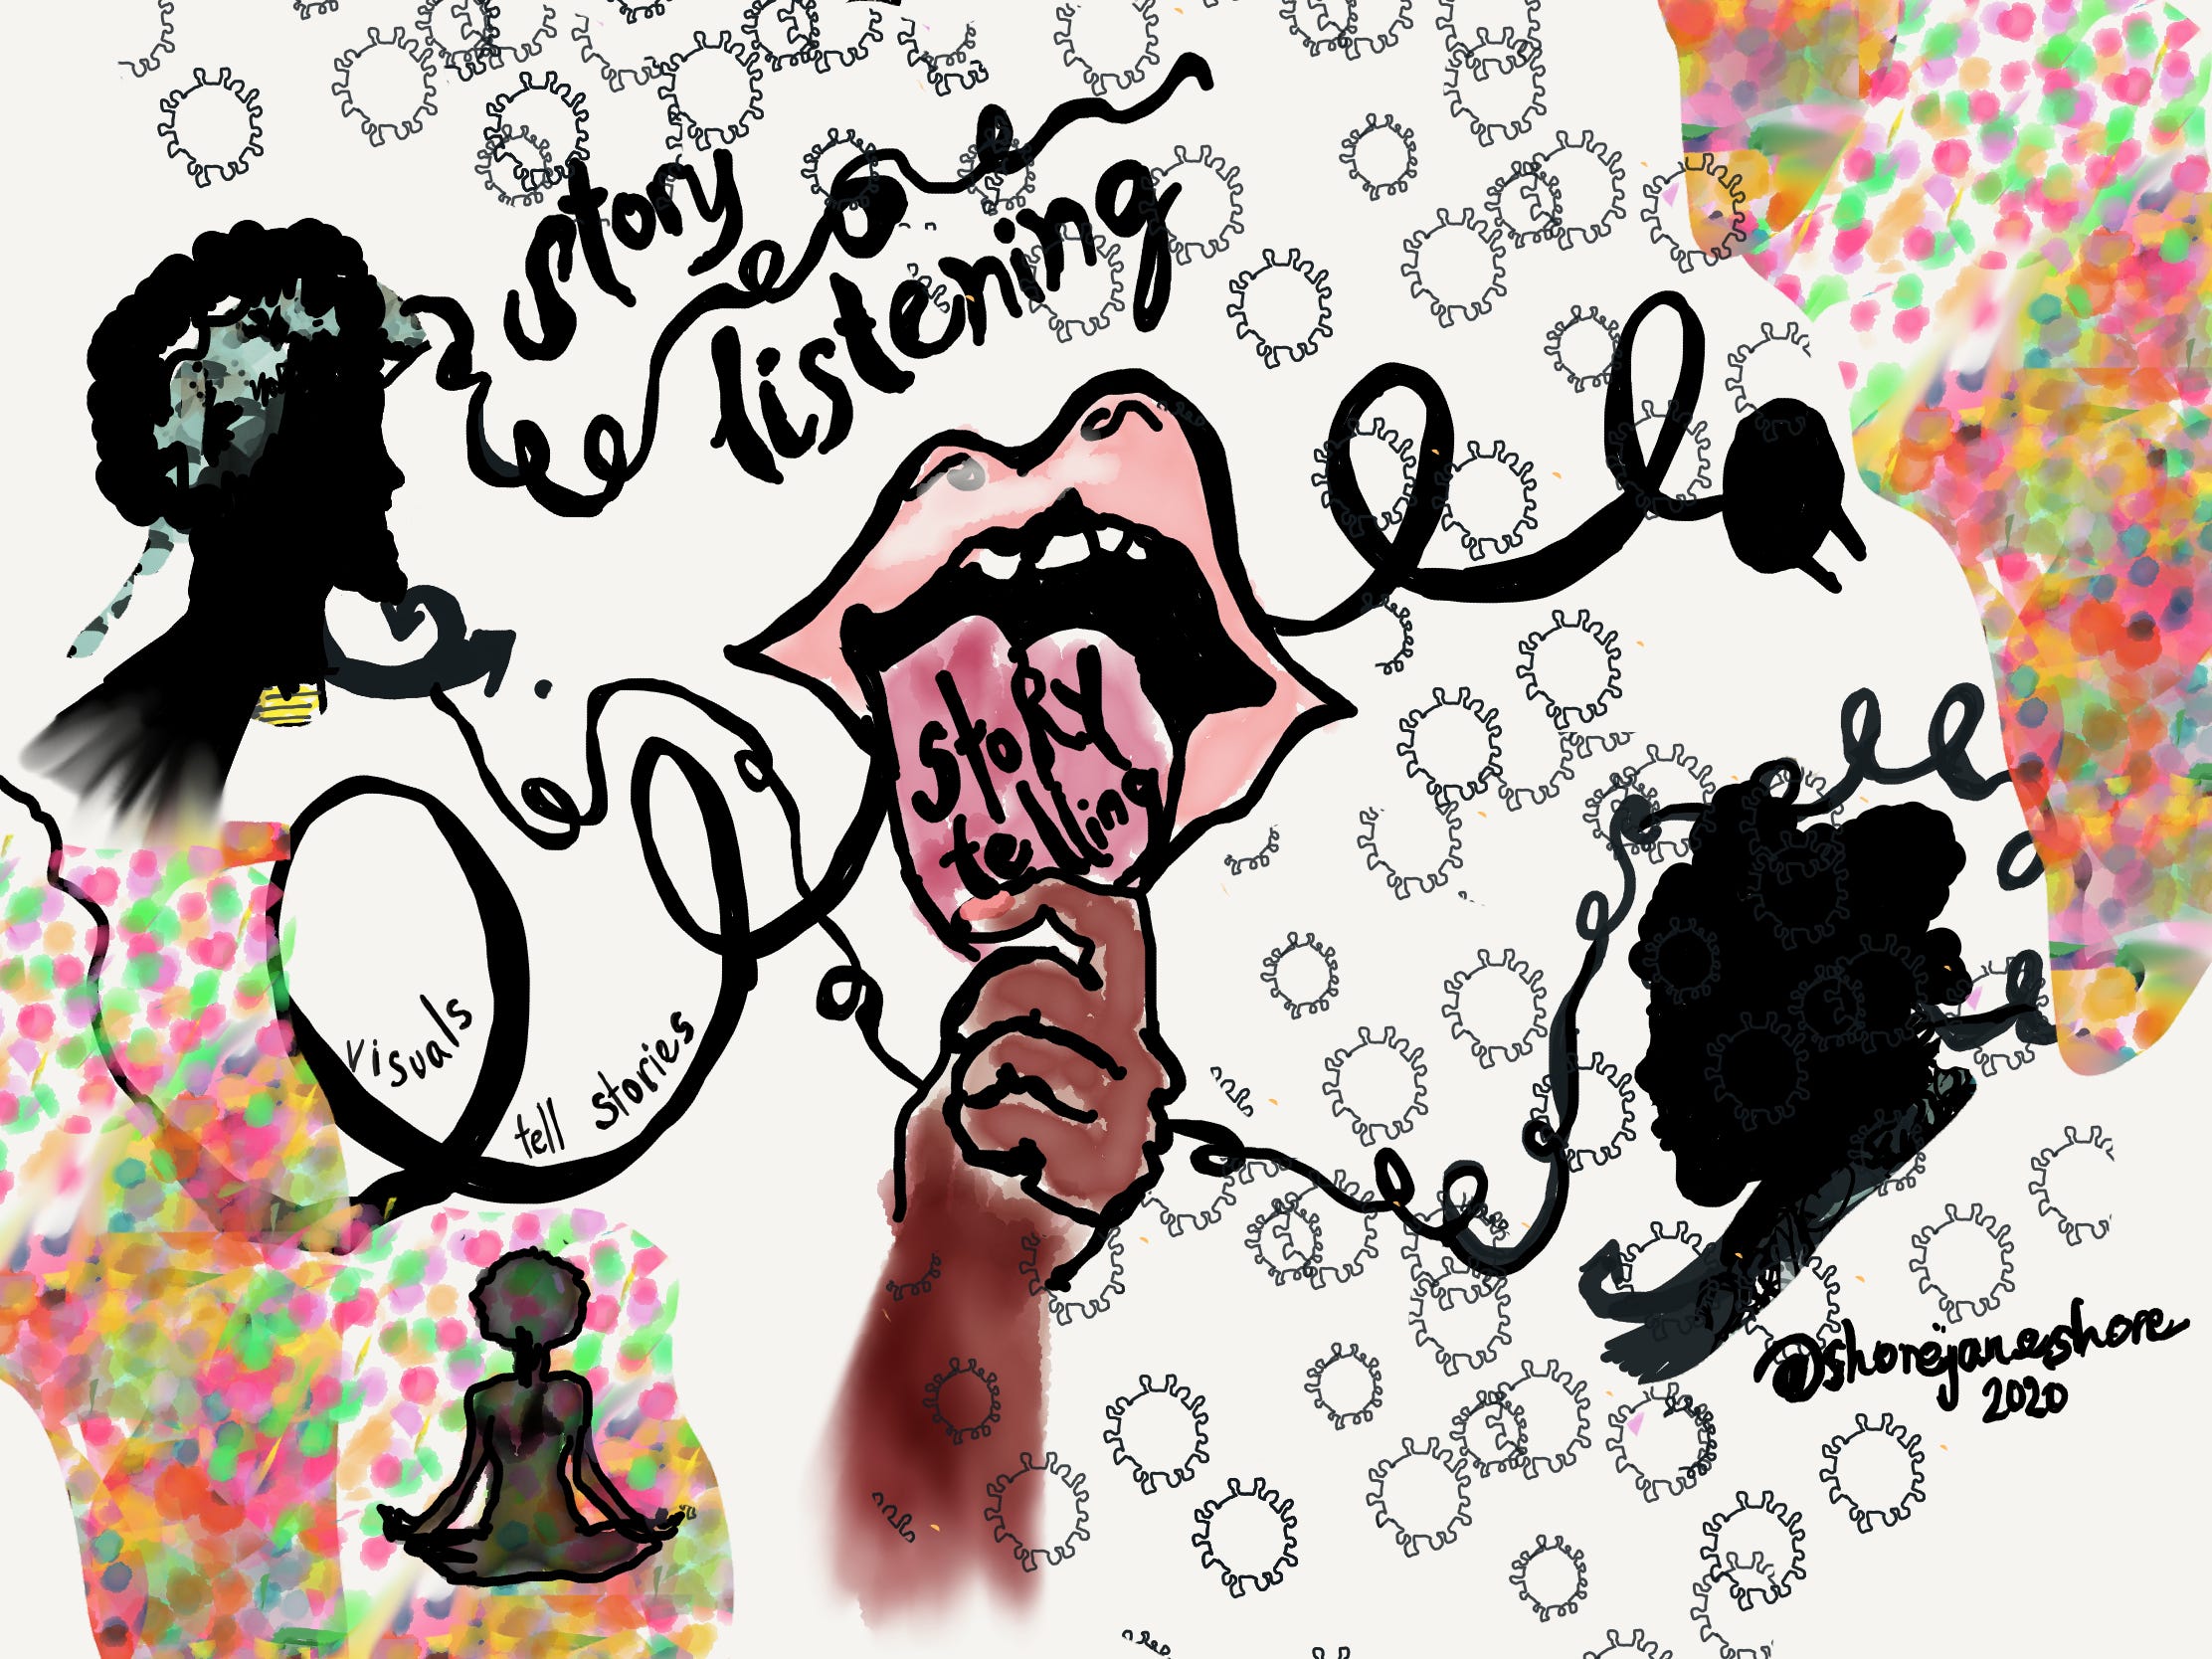
Many of us start our mornings watching or listening to the news, reading magazines, books, and even scrolling through Twitter or Instagram. Those of us with children read bedtime stories to them at night. Stories reveal themselves and resonate throughout our daily lives. Telling stories helps us identify ourselves, interact with one another, and make sense of the world. Throughout history, storytelling–in words, gestures, and visuals has been one of our most fundamental forms of communication.
Well-crafted stories should not be limited to book authors, journalists, or toastmasters. In any situation in which we are opening the hearts and minds of others to new information, new people and new ideas, storytelling is the channel by which we are led to action.
This is especially true in research. When conducting research, the data we collect can feel exciting and meaningful, but when presented as a spreadsheet, series of bullet points, or a list of facts, lies flat. In a world driven by data, where vast amounts of decontextualized information can become currency for persuasion, stories bring us together as humans.
Combining data, narratives, and visuals can bring these deep and powerful messages forward in ways that stories, numbers and data alone cannot. Learning to harness the power of visual stories allows us to be more inclusive, more connected, and more memorable.
And the science behind (visual) storytelling is real.
Cognitive neuroscience has begun to give us a further window into what is actually taking place when we tell, listen to or read stories. There’s a phenomenon called neural coupling, which is a term used to describe what happens to the audience of a story–a sort of brain patterning that mimics that of the storyteller.
There are scientific elements relevant here as well. Organic chemicals like cortisol, dopamine, and oxytocin are released in the brain when we experience storytelling. Cortisol contributes to forging memories. Dopamine, which helps regulate our emotional responses, keeps us attentive and engaged. When it comes to creating deeper connections with others, oxytocin is associated with empathy, an important element in building, deepening or maintaining good relationships. Storytelling activates our minds, our hearts and our connections.
Not only do listeners of narratives gain a full sensory experience, but adding a visual component brings the information to a greater area of the brain. Scientists have found that information viewed in spreadsheets and bulleted formats activates the two areas of our brains where we perform language processing and making meaning of words: Broca’s area and Wernicke’s area. Brain images show that our minds really come alive, though, when we view this data as a visual story. Cognitive scientists have identified six or more neural pathways may be activated when viewing and listening to a memorable visual story.
How does this connect to research?
As applied researchers with deep interest translating and making interpretable research for practice, we find these discoveries confirmatory. While data might just seem like a collection of numbers, all you have to do is turn it into a visual story for a more lasting impact.
The four-step structure of storying—beginning with the context (Once upon a time…), then the conflict or challenge, the climax or resolution, and ending with closure (…and they lived happily ever after)—forms a mental map upon which new information can be laid. Rather than being overwhelmed with details, with this basic storying outline, people have space then to become engaged with a narrative. This is the story making.
To transform this work through visual storytelling, we offer a model of visualizing that draws on Simon Sinek’s golden circle, The Golden Circle of Data Visualization.
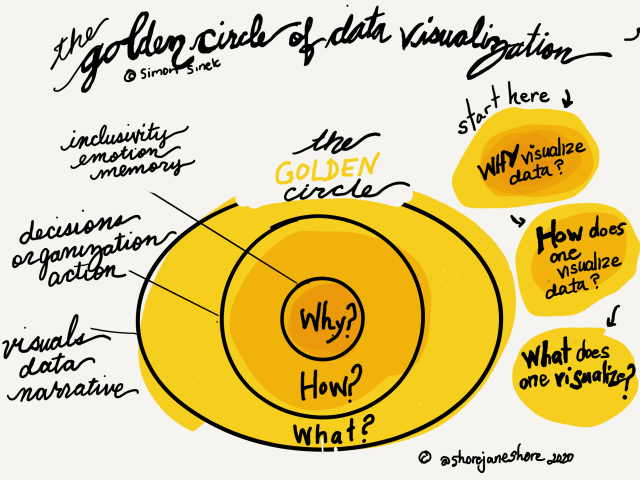
Simon Sinek developed the Golden Circle as a communication and leadership framework. It is used in marketing, business, and entrepreneurial settings. In this case, it is presented as a way to further underline the importance of clearly defining and communicating evidence that contributes to the WHY of visualizing research stories, followed by HOW, and finally answering WHAT moves into the practical.
Why use visual storytelling in research? An IDEA
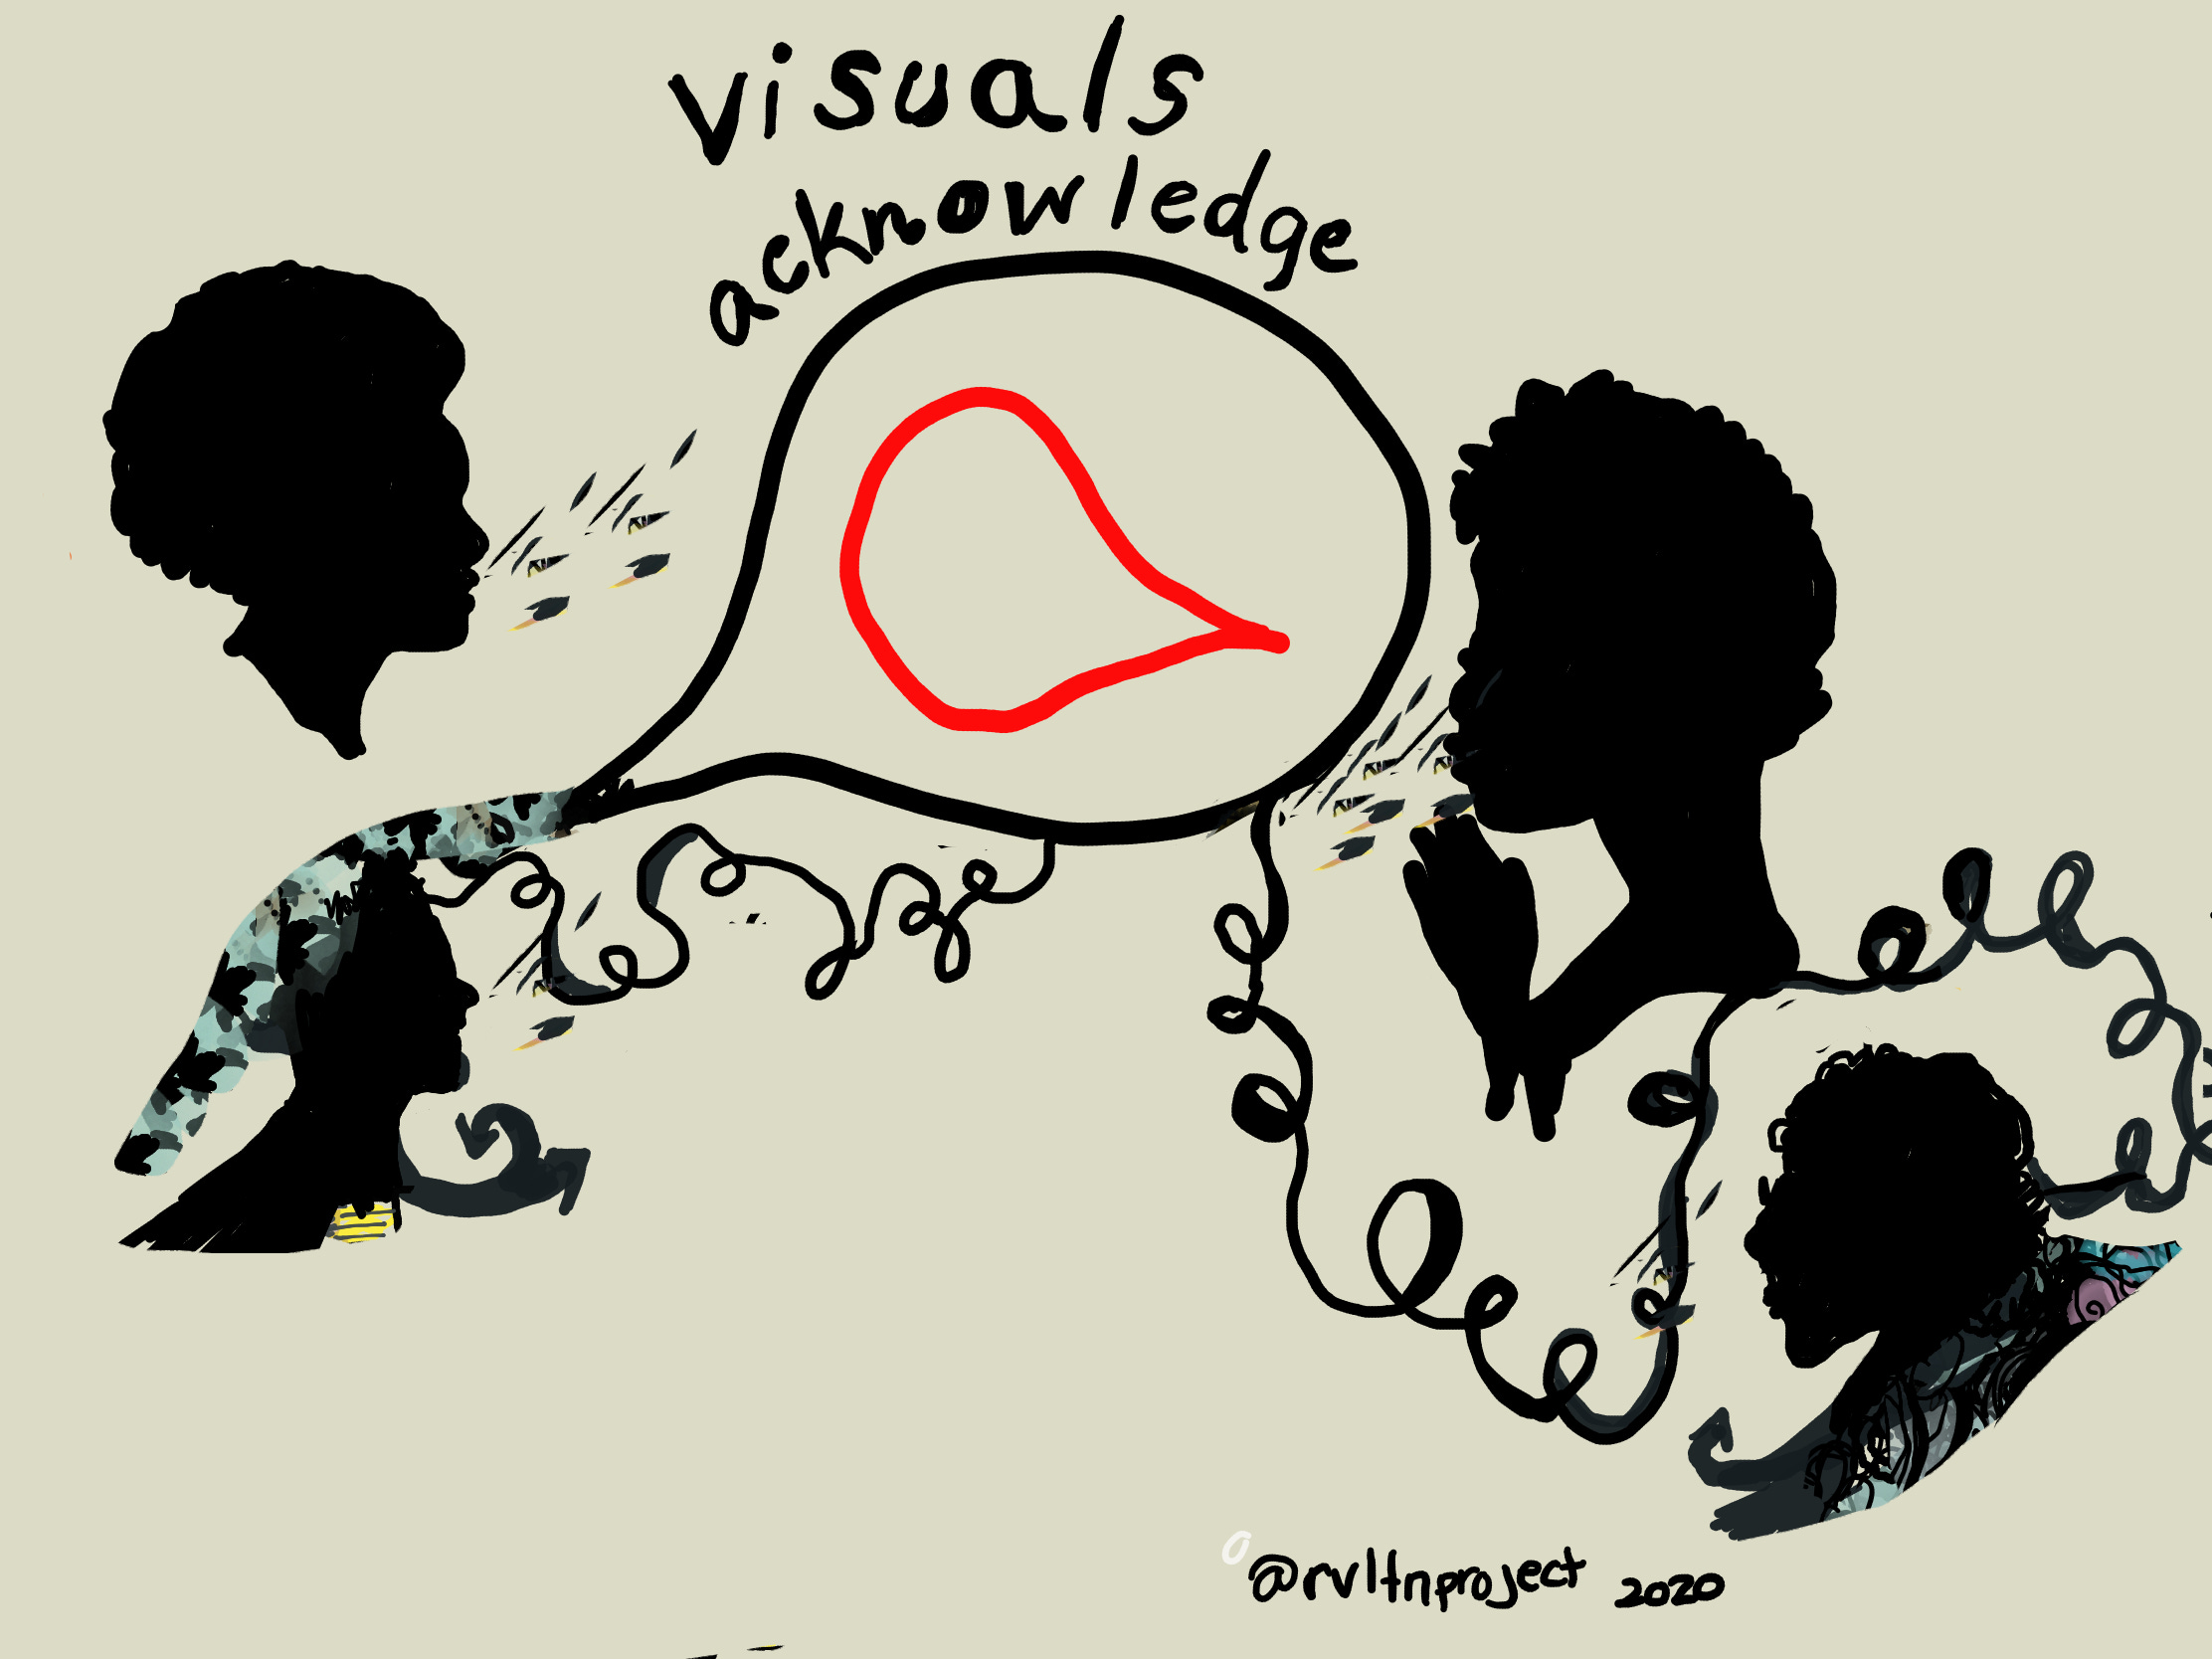
Inclusion: Stories help us make sense of a complex world. By extracting relevant data and placing it into a visual format that fits into a narrative, research is made accessible to a wider audience. This includes more equitable transmission of ideas for a range diverse audiences, possibly even transcending text, spoken language, and culture to make conclusions more universal.

Durability. It’s easier to remember new information when it is presented in the form of a story—think Benjamin Franklin and the kite. Even more so from a visual story. With fragmented attention spans, and an overload of data coming at us all of the time, visual stories help make learning more durable. Visual stories can be evocative, and therefore, stickier.
Emotion. Data can be humanized through visuals. When the brain is presented with factual information, only two of its regions activate. As stated earlier, fMRI studies show that visual storytelling causes many additional areas to light up. This has to with the various sensory experiences that contribute to stories–and emotional responses like distress, happiness, compassion, empathy, fear.
Action. Pioneer “neuroeconomist” Dr. Paul Zak’s research found that people are more likely to give to a charity after viewing an emotionally charged story. His award-winning short 2013 film describes his research, which connects the powerful chemicals released in storytelling to attention grabbing, pleasure seeking and finally to behaviors. Visual storytelling compels action.
How do we tell effective visual stories with data?
Make Decisions. Authors of data visuals need to decide what data is most important. Numerical information can be overwhelming to analyze and present if it is not distilled. Once decisions about what is most important are made, then data can be transformed into a visualization.
Set Goals. Knowing the audience is one of the most important aspects of stories. Who do you want to reach? What is the intended setting? What do you want the audience to do, be or think? This will determine what aspects of the story to concentrate on – pieces that are most important.
Be Human-Centered. To know your audience, however, it is necessary to first know how to read data and how to use it. What question are you trying to answer, or challenge are you trying to resolve?
And finally, what do you do to tell an effective visual story?
The key to all effective communication, whether it be oral, through writing, or information visualization is to hone in on the main message. The book Good Charts, by Harvard Business Review, provides a valuable data visualization framework that has inspired the suggestions and chart below.
As visualizer David McCandless opines, “Visuals must combine information, function, visual form, and story. Without story, you get 'boring.' Something that looks good but isn't that interesting. Similarly, if you combine visuals, information & story without considering functionality and your goal, you get something useless.”
These two questions may aid in making decisions about what sorts of visuals to use:
Is the information data-driven and/or story driven?
Is the objective to make an evidence based claim and/or explore something theoretical?
Decisions must be made regarding which data to present and what sort of story it will tell. Research shows that audiences prefer visual elements over numbers in presentations, and will remember information more accurately if shown in graphic narrative form. Seeking feedback on visuals through dialogic engagement–intentional, dialogue-based thought partnership to engage and challenge layers of interpretation–helps to more critically co-construct meaning
Using the graphic below, responses to the above questions can be plotted in one of the four quadrants to aid in visual story building decision making.
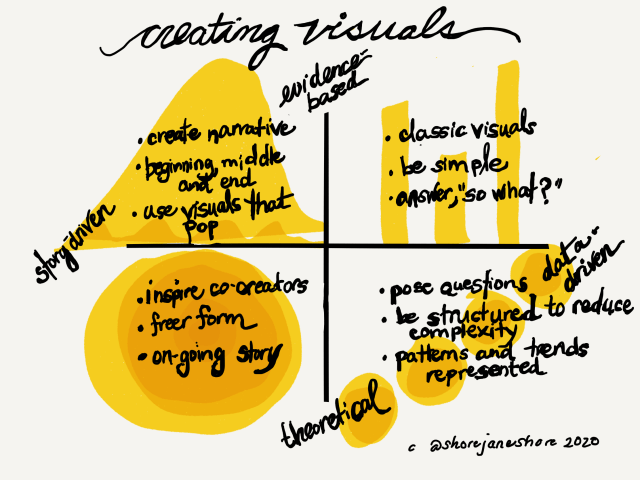
Evidence-based,story-driven visuals generally require a simplification of a key idea and the incorporation of diagrams and other illustrations. The research that falls in this quadrant may be cross-industry, so requires the bringing together of relationships, research methodologies and combinations that may be novel. At times these may also include timelines, steps, pyramids or other gradual and integrated progressions.
The story-driven, theoretical includes stories that are still evolving and meant to bring co-creators into an on-going conversation. Here, the form is freer, meant to evoke emotion, ideas, questions and an invitation.
In contrast, the third category to the data-driven, theoretical requires a visualization that is more complex than all the others. The ideas in the bottom right is to pose a theory or explanation when uncovering patterns and trends.

Finally, data-driven, evidence-based includes the more classic visual categories, like bar charts, line graphs, and scatter plots. It is important to continue to underline the “So what?” of the data in these stories. What is the message, and why is it being presented? The goal is to provide context for a conclusion, so the visuals should include a simple narrative and drive home a clear and focused point of view.

Conclusion
People can absorb information in graphic form that might elude them in words. Images are effective for all kinds of storytelling, especially when the story is complicated, as it always is in research with human beings! Research visuals can be essential for communicating results in ways that make them accessible to diverse audiences, making results more memorable and inclusive, and making research easier to use.
While visualizations may reveal fascinating patterns and trends as well as share connections in data that might be challenging or impossible to find any other way, few scientists take the same amount of care with visuals as they do with collecting, analyzing data or writing about it. Graphs and diagrams that accompany most research publications tend to be the last thing authors consider.
Focusing on visuals may increase the quality and improve the progress of scientific research dissemination. And with more and more research visuals appearing in news and social media — illustrating everything from the growing political divide to changes in rainfall— an increased use of visuals has the potential to make research more accessible, inclusive and ready to use.